
Ethereum 2026: The $1,800 Line That Could Decide Summer’s Fate

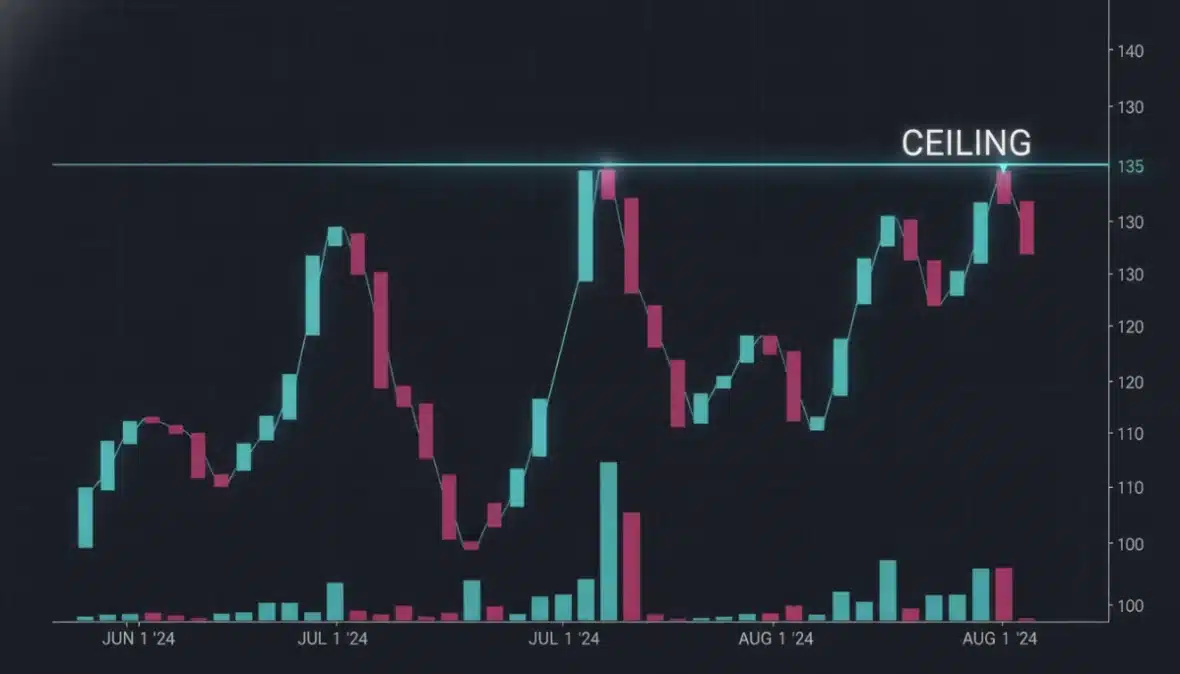
As of July 13, 2026, Ethereum (ETH) is stuck in a high-stakes battle at the **$1,800** price level, a barrier that may determine whether the summer delivers a recovery or a deeper slump for investors .
The current price sits near **$1,779**, creating a tense “compression zone” where buyers and sellers are locked in a multi-dimensional tug-of-war . This isn’t just a round number; it’s a **structural convergence** of key technical markers, including the daily pivot point, the 50-day Exponential Moving Average (EMA50), and short-term resistance clusters on hourly charts .
Why $1,800 Acts as a Fortress
In technical analysis, certain levels act as magnets or walls. The **$1,799–$1,800** range is currently functioning as a fortress, not merely a psychological threshold . For Ethereum to break out, it needs a **decisive, volume-backed close** above $1,800 to transform that ceiling into a new floor . Without this, bears are likely to keep the price suppressed and exhaust buyer momentum .
Timeframe Dissonance: Daily Hope vs. Hourly Fear
One of the most confusing aspects of the current market is the “**timeframe dissonance**” .
- Daily Chart (Optimist View): ETH is holding above its 20-day EMA, and the daily MACD has just signaled a bullish crossover—a classic “bottoming” indicator suggesting selling pressure is fading .
- Hourly/15-Minute Chart (Realist View): The narrative flips to bearish. Sellers are aggressively defending $1,800, and the Relative Strength Index (RSI) is leaning toward oversold territory .
This disconnect means buying without a confirmed breakout is like “running into a headwind” .
Macro Headwinds: Bitcoin’s Dominance
Ethereum cannot be analyzed in isolation. Bitcoin dominance is hovering around **56%**, a figure that explains why altcoins struggle to gain independent momentum . In a “risk-off” environment, capital flows toward perceived safety, and with geopolitical tensions and macroeconomic uncertainty (including interest rate shifts), the **Fear & Greed Index** remains locked in “Fear” at 28 .
When fear dominates, investors seek liquidity and exits rather than altcoin value, allowing Bitcoin to dictate the market tempo while Ethereum fights for redirected volume scraps .
On-Chain Data: Panic or Strategic Pivot?
Over the last 24 hours, **Decentralized Exchange (DEX)** activity has surged dramatically. Uniswap V3 fees jumped nearly **49%**, and Curve DEX saw a similar explosion in volume .
A fee spike during a downturn is a classic “tell” that rarely signals new buyer entry. Instead, it points to **active repositioning**: investors moving tokens to cold storage, rebalancing portfolios, or hedging against further downside . This suggests the market is twitchy, with participants bracing for volatility rather than launching a bull run .
Two Possible Paths for the Coming Week
The market is facing two distinct realities:
1. The Bullish Breakout
If Ethereum sustains an hourly close above **$1,800**, the technical landscape shifts instantly. This breach could trigger a **short-squeeze**, forcing resistance bettors to buy back positions and creating a self-fulfilling pump . The path would open to **$1,825**, with potential tests of upper Bollinger bands near **$1,884** . For bulls, $1,800 is the key to unlocking a genuine recovery .
2. The Bearish Slide
If the $1,800 wall holds and **$1,753** support breaks, momentum evaporates. Below $1,753 lies a “**structural vacuum**,” meaning significantly less historical buying interest, which could cause rapid price slips . In a fear-driven market, losing this floor could invite a wave of technical selling that tests even hardened holders .
Strategy: Patience in a Volatile Regime
For average traders and investors, the lesson is simple: **Don’t fight the range** . Flipping coins while price is pinned between **$1,753 and $1,800** is a high-risk, low-reward game of chance . Waiting for a confirmed breakout ensures you aren’t betting blindly against a wall .
